Pricing rentals with market data
Get Rent Ready · 2025 · Product design · Data modeling · Build
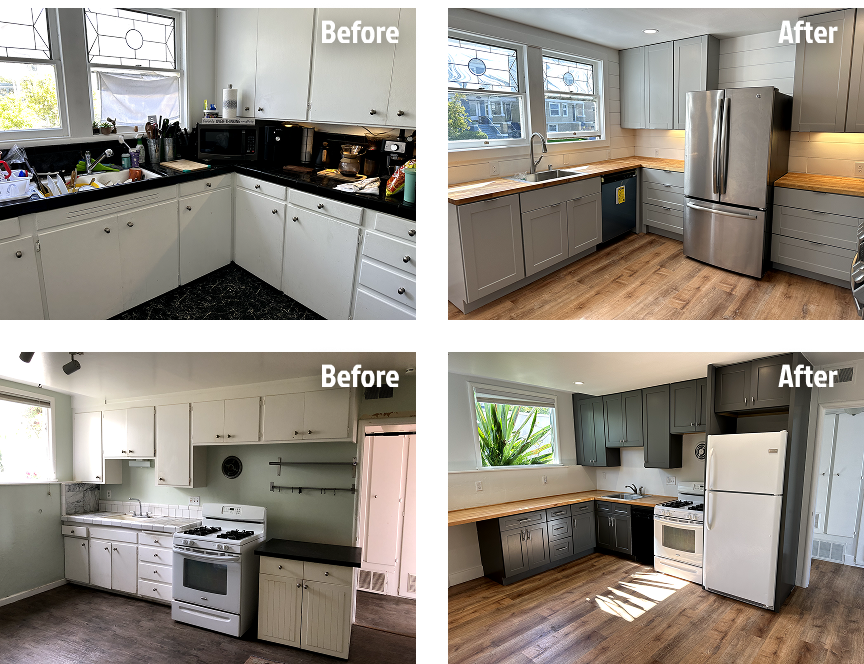
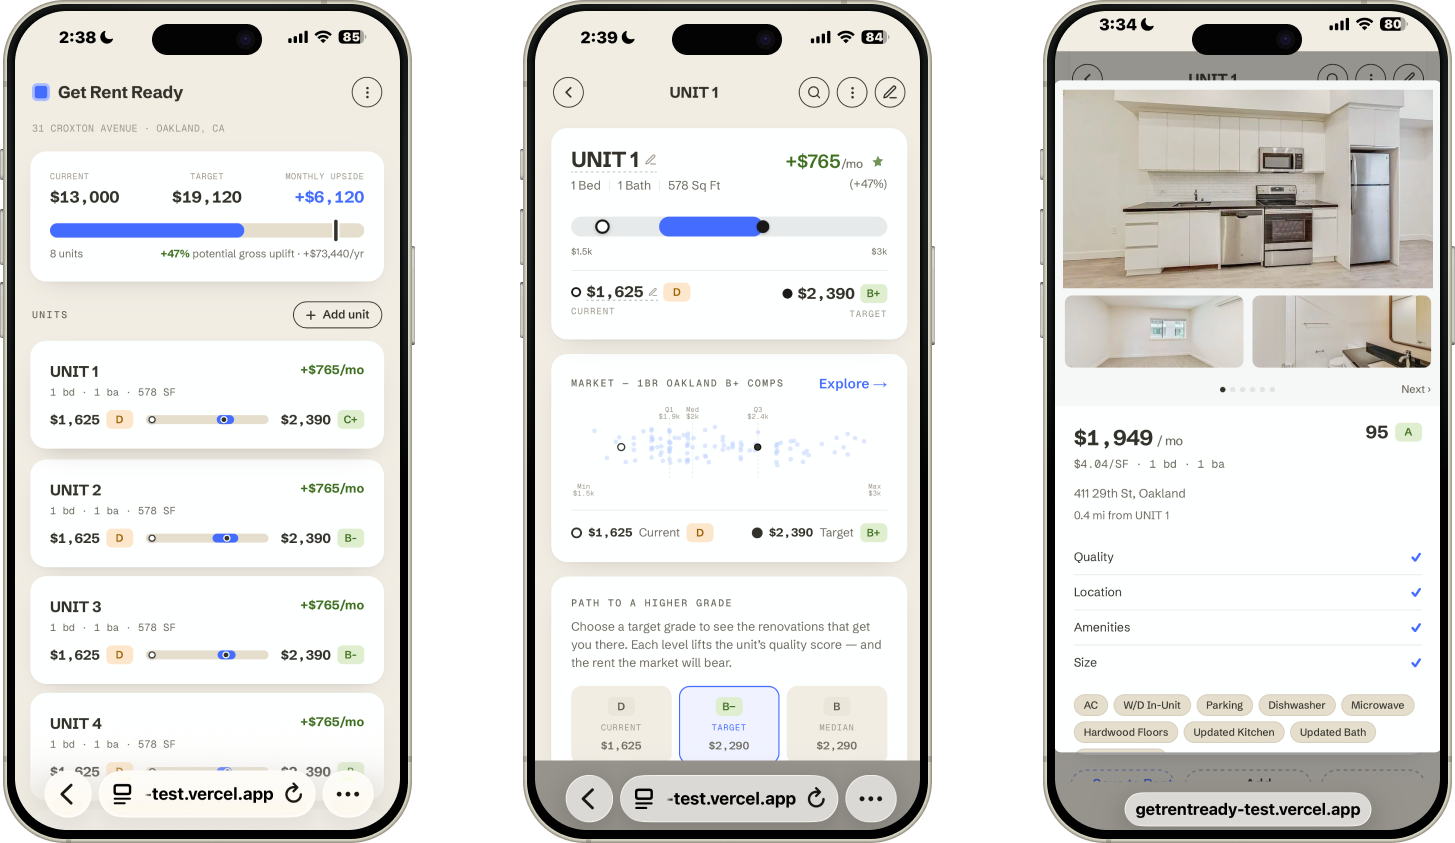
I graded 900+ rental listings, modeled what drives rent, and turned it into an app that shows owners each unit’s rent gap and which upgrades pay back. On a real property, it raised rental income 24%.
24%
increase in rental income
5–6%
increase in estimated asset value
4–5%
reduction in operating expenses
900+
rental listings graded
The problem
Investors have plenty of market data but no clear way to tell which units are underpriced or which improvements will pay back. Upgrades get made on instinct, and rent upside goes unclaimed.
How the model works
- 1Collect · Collected comparable rental listings from across the local metro area.
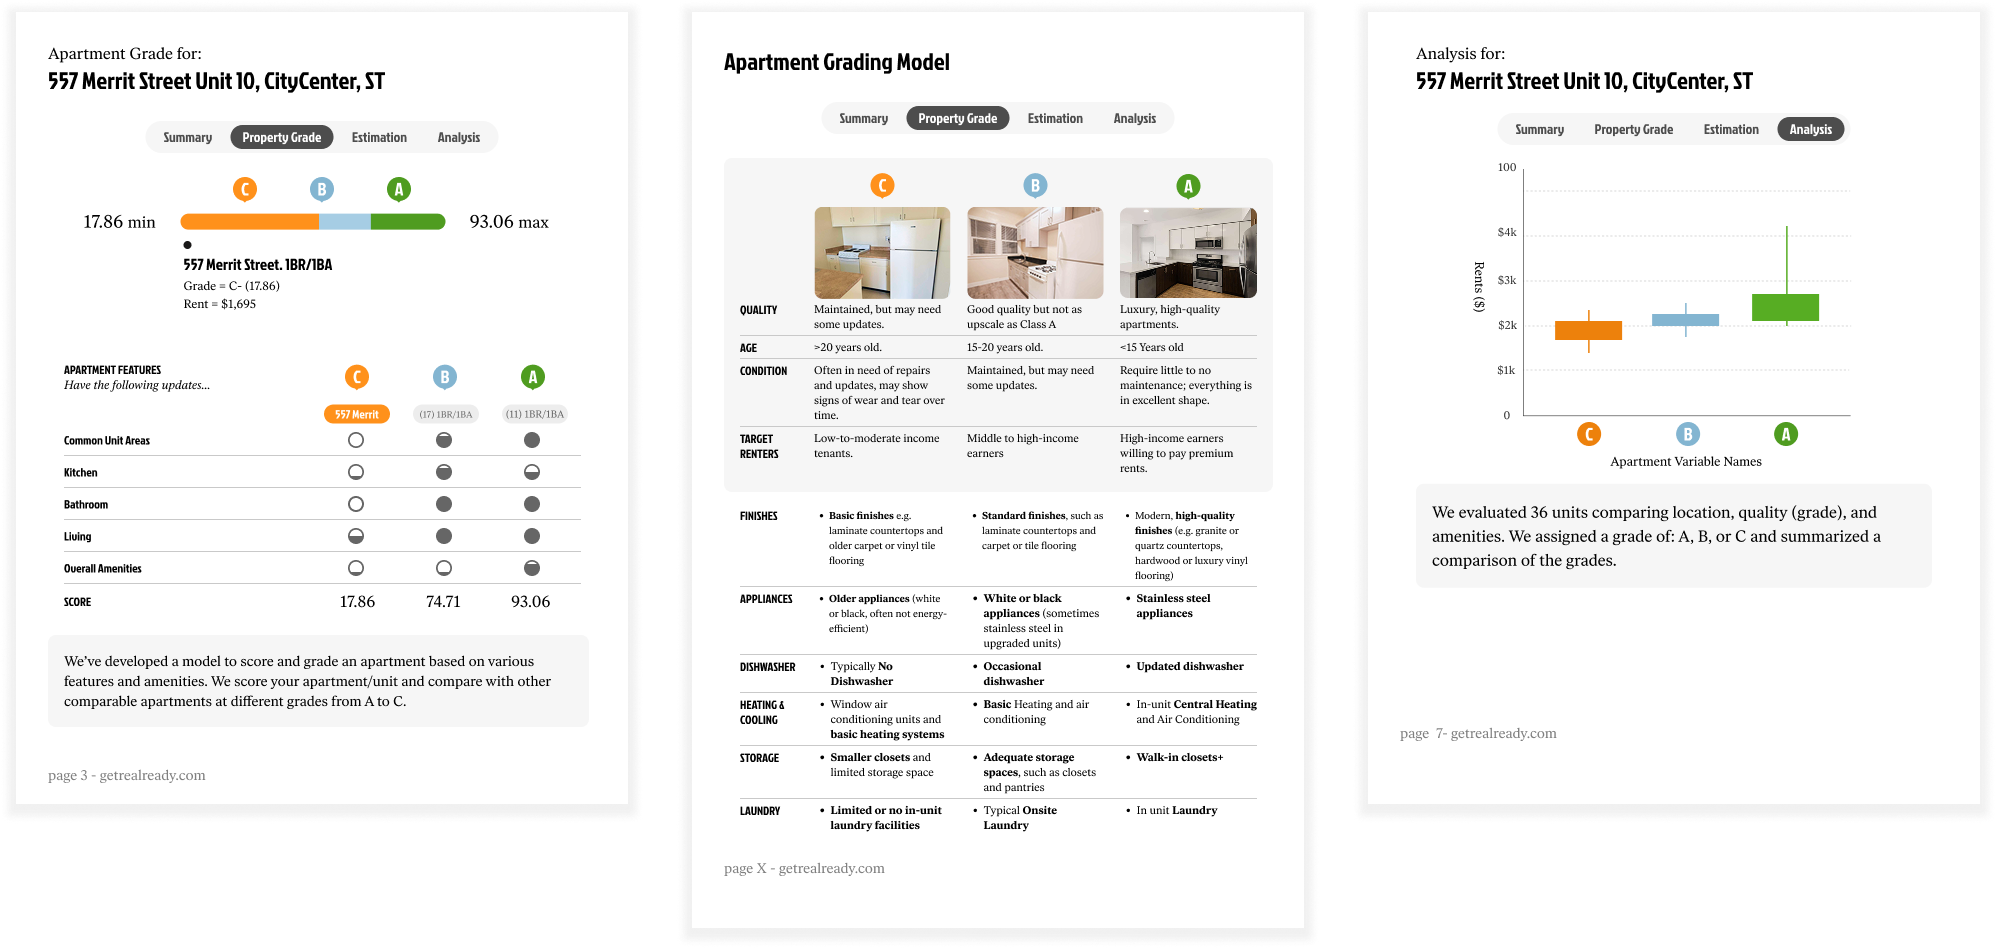
- 2Grade · Scored each listing from D to A on location, amenities, quality and size.
- 3Model · Fit a linear regression on the graded data to estimate market rent for any unit.
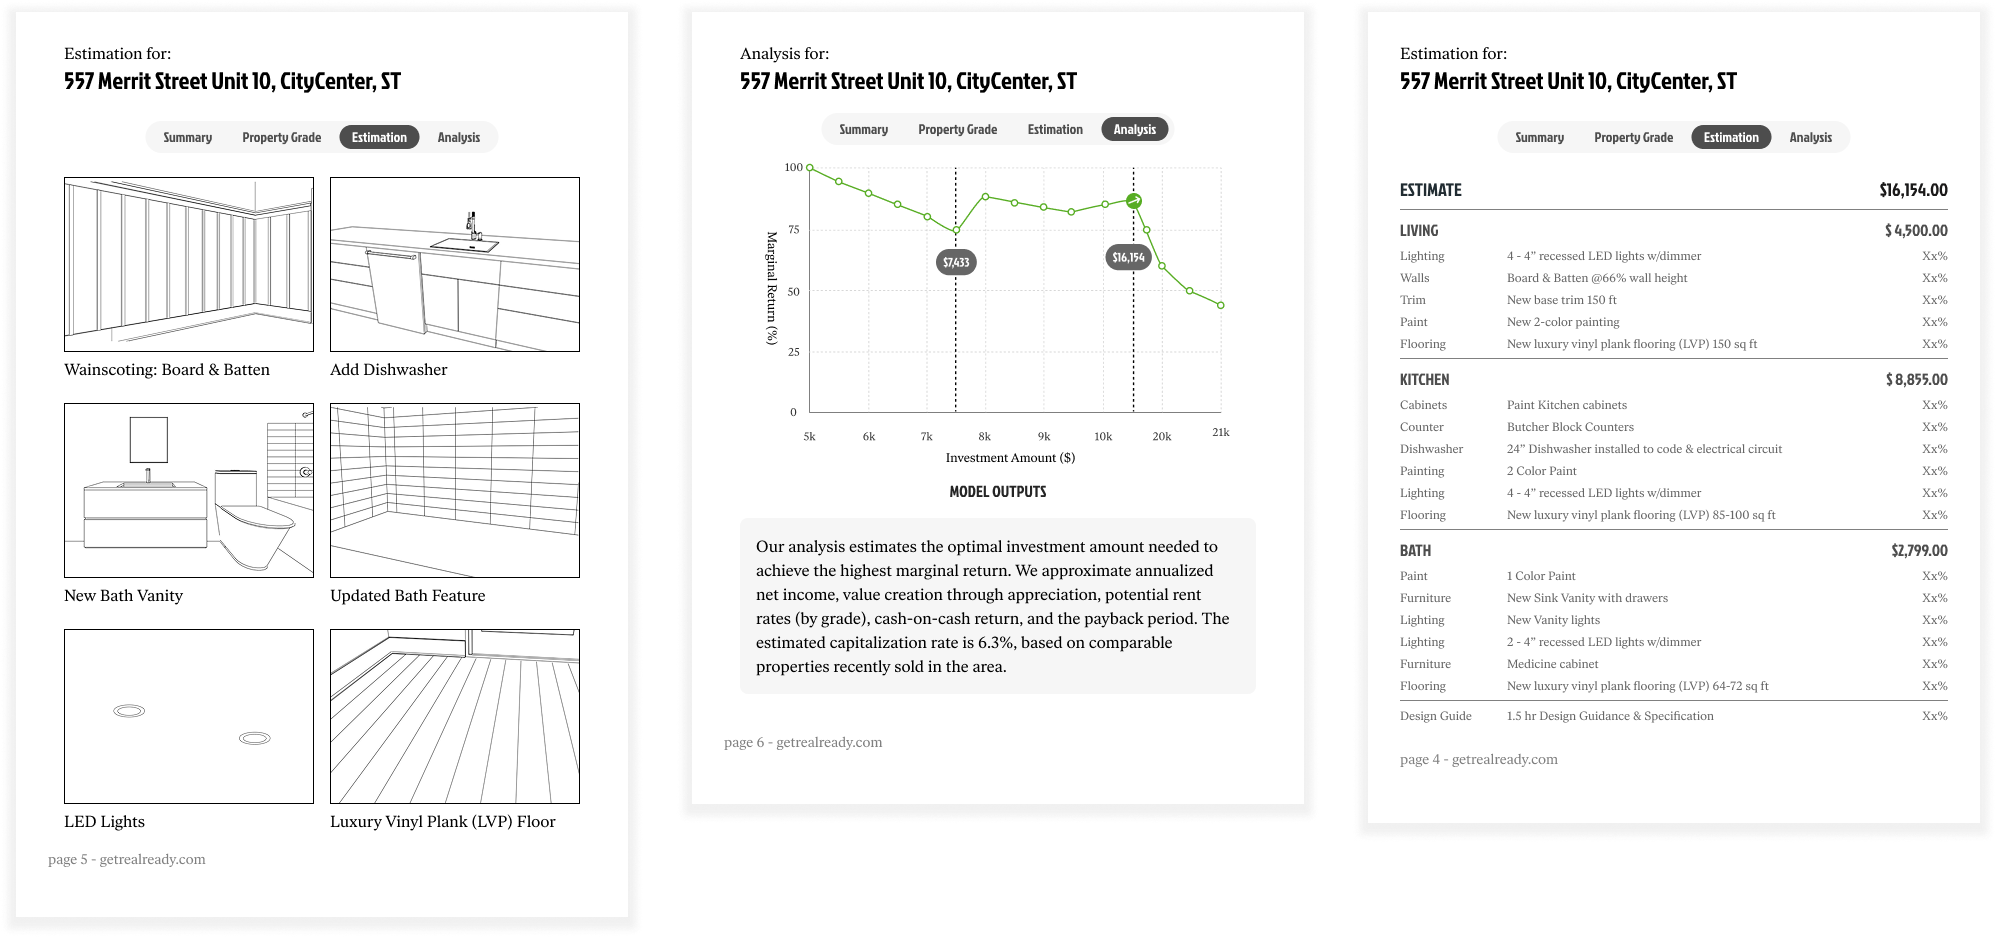
- 4Act · Compared each unit’s current rent with its estimate, and priced the upgrades that close the gap.
Exploring the data
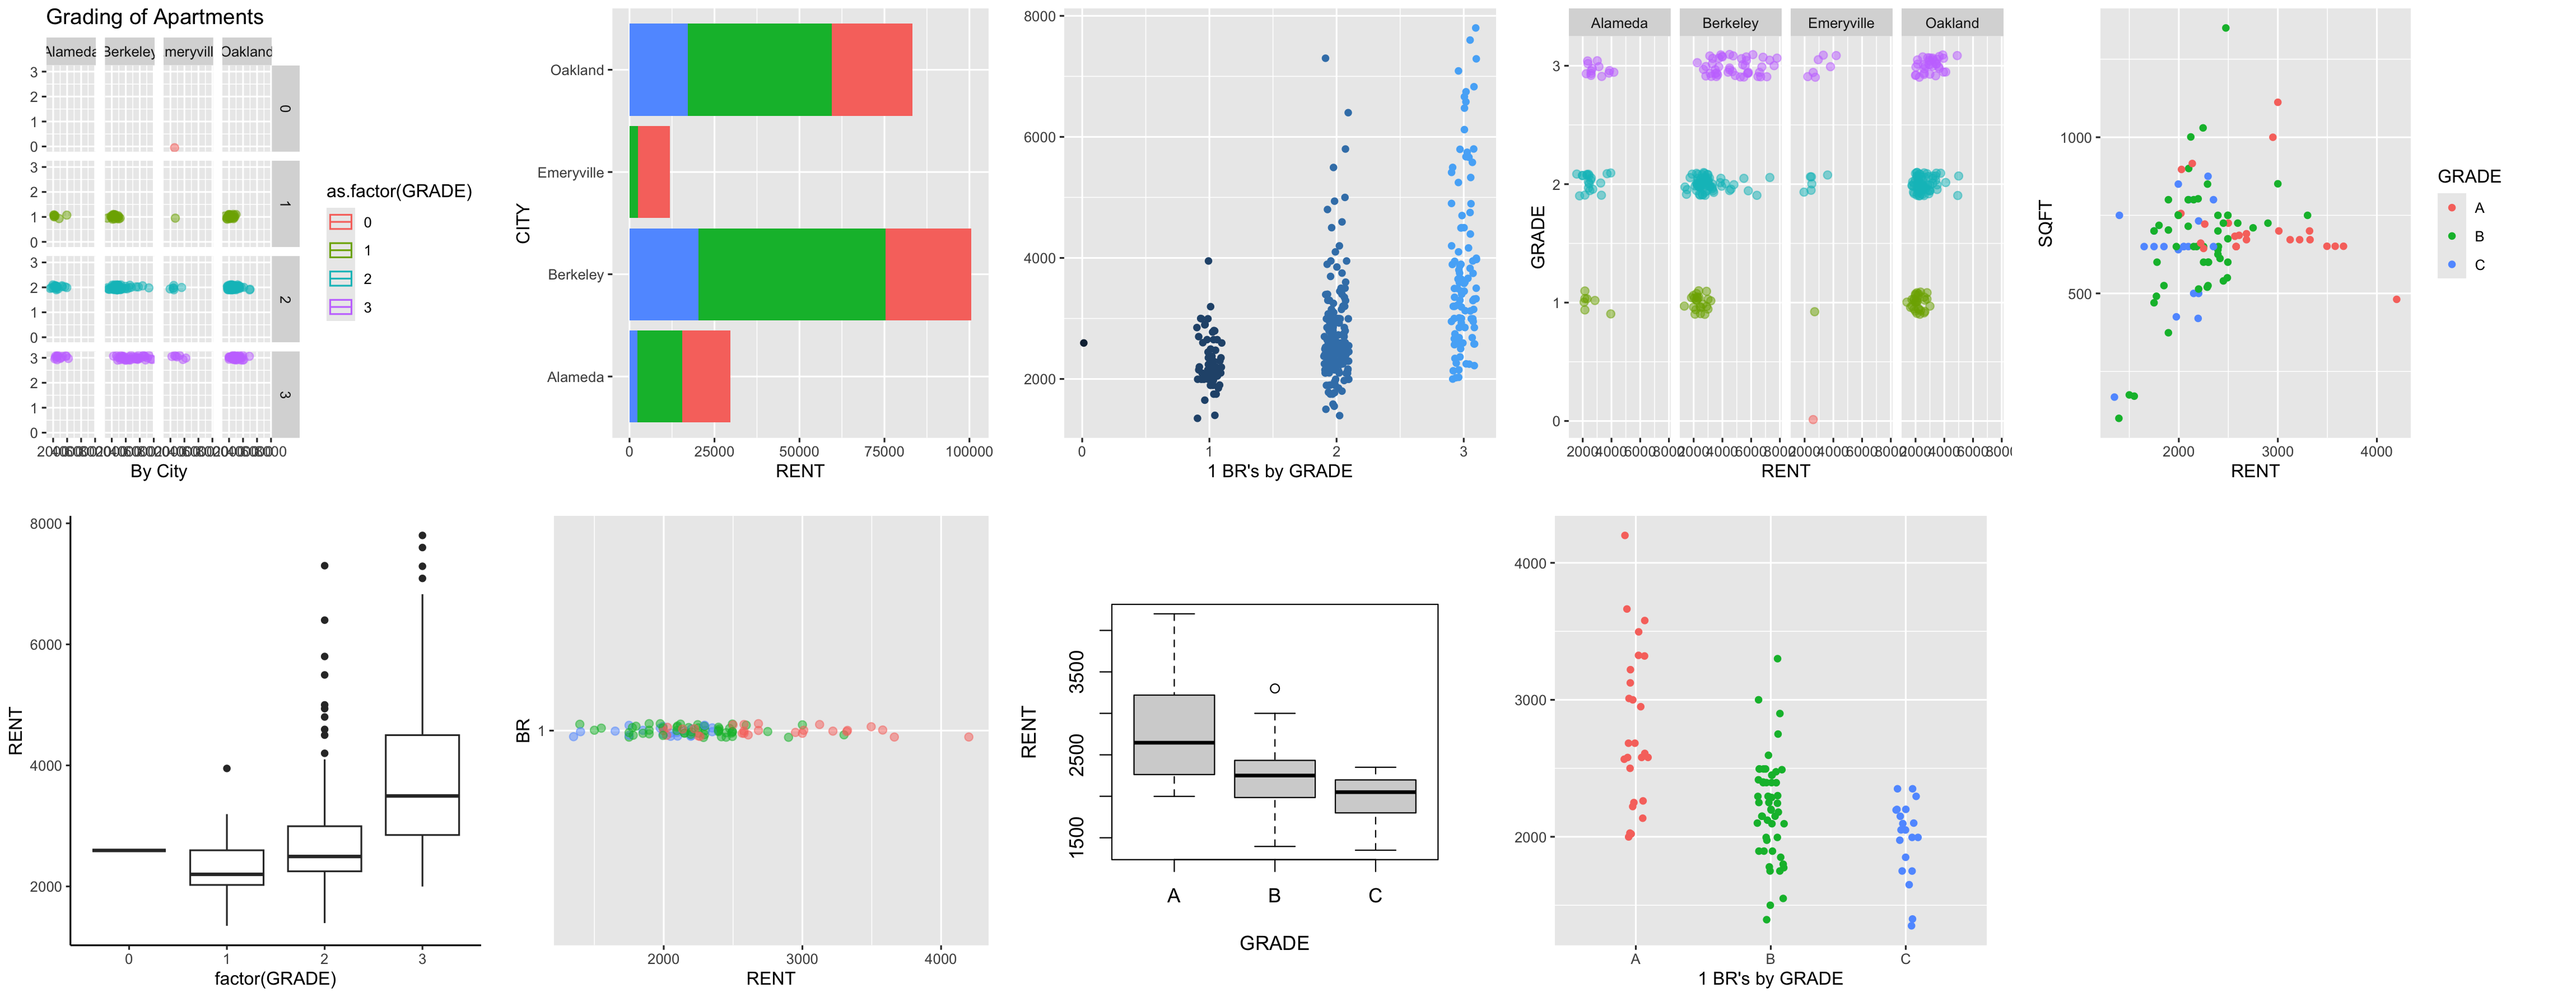
Early analysis in R: how rent varies by grade, area, bedroom count and size.
What I did
- Renovated units on a real property to learn the rent lift, cost-versus-return thresholds and what renters respond to.
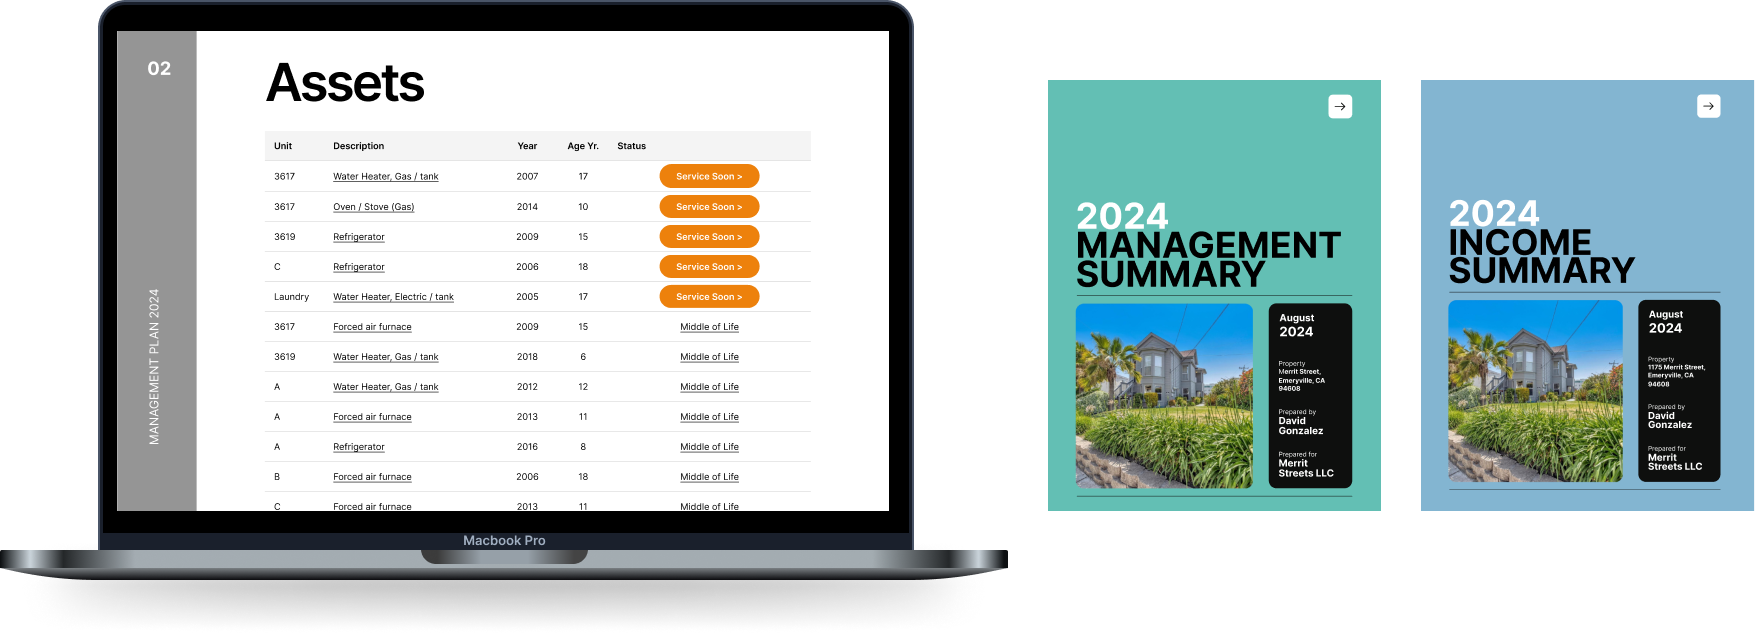
- Tested an early asset-management concept, saw little traction, and refocused on rent and cash flow.
- Designed the app in Figma, then built it with Claude Code on Supabase.
The product
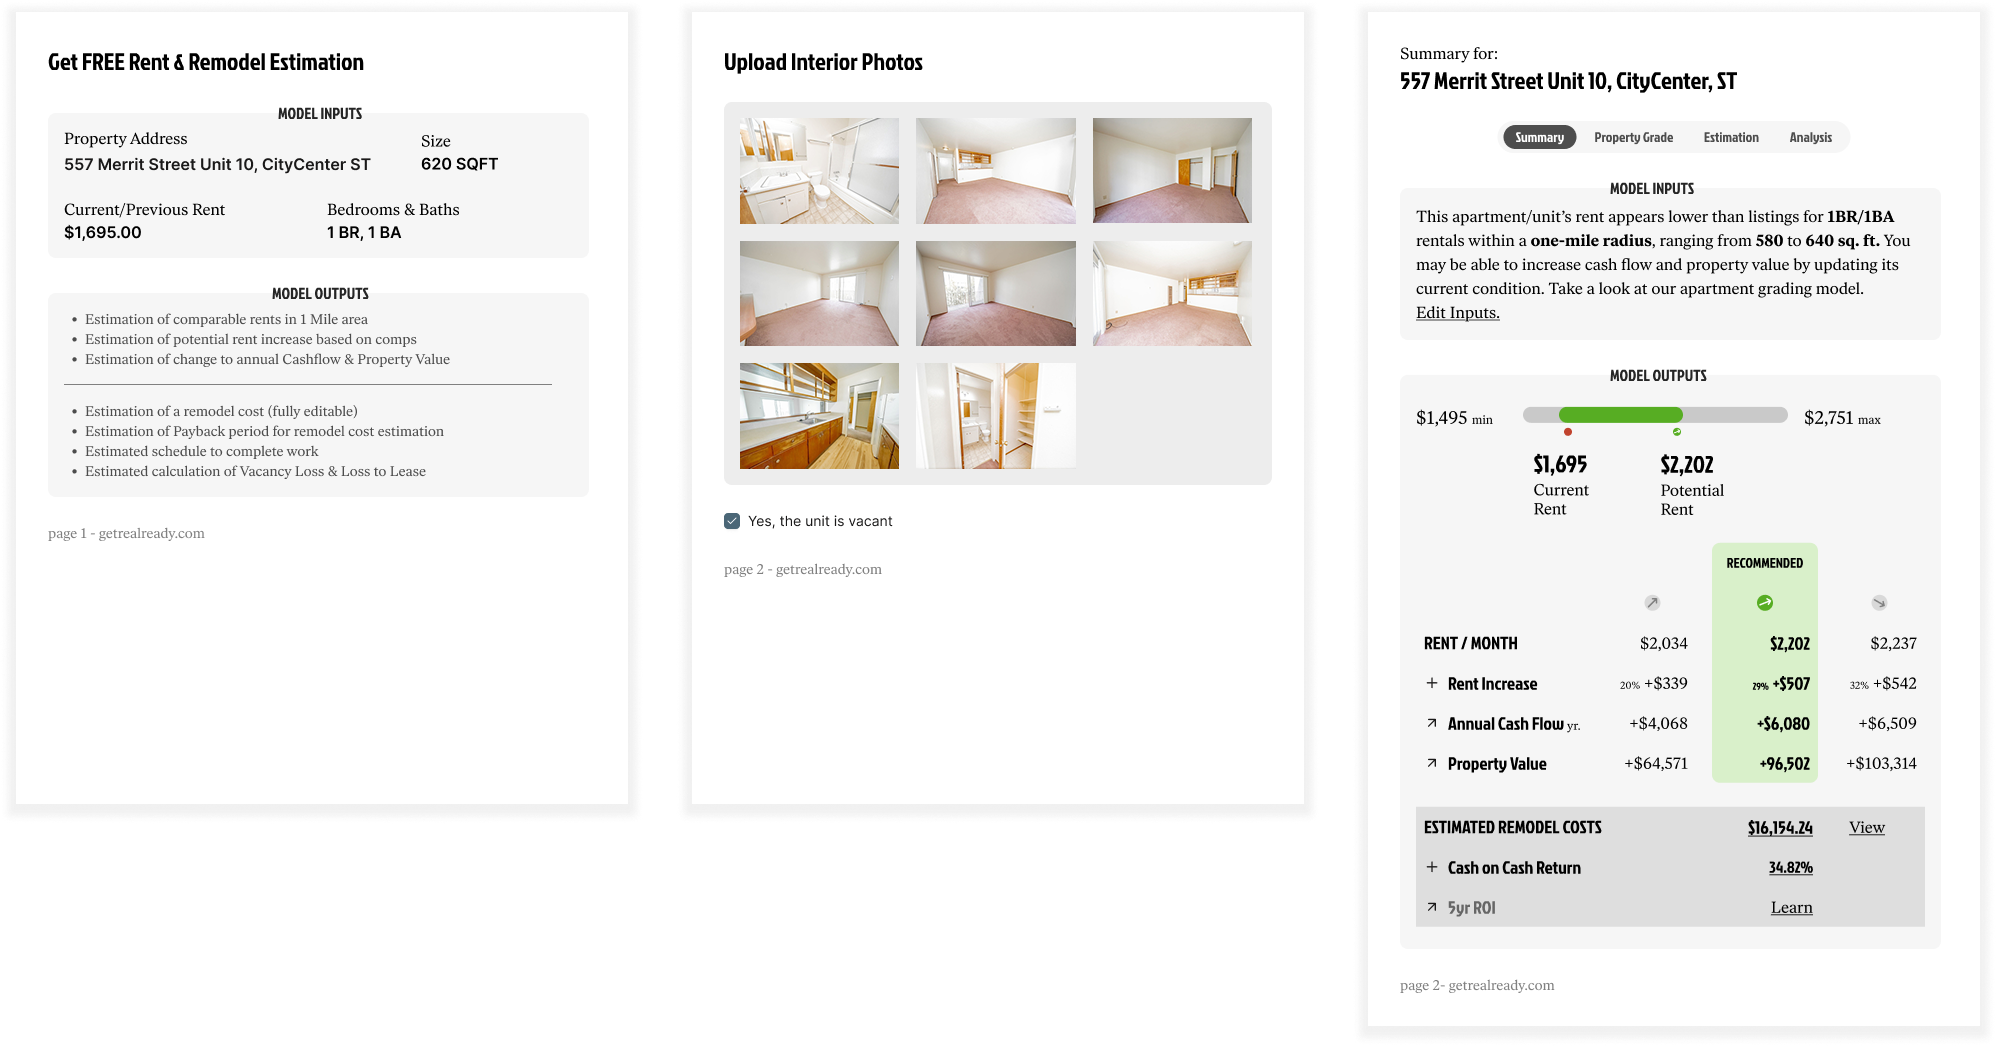
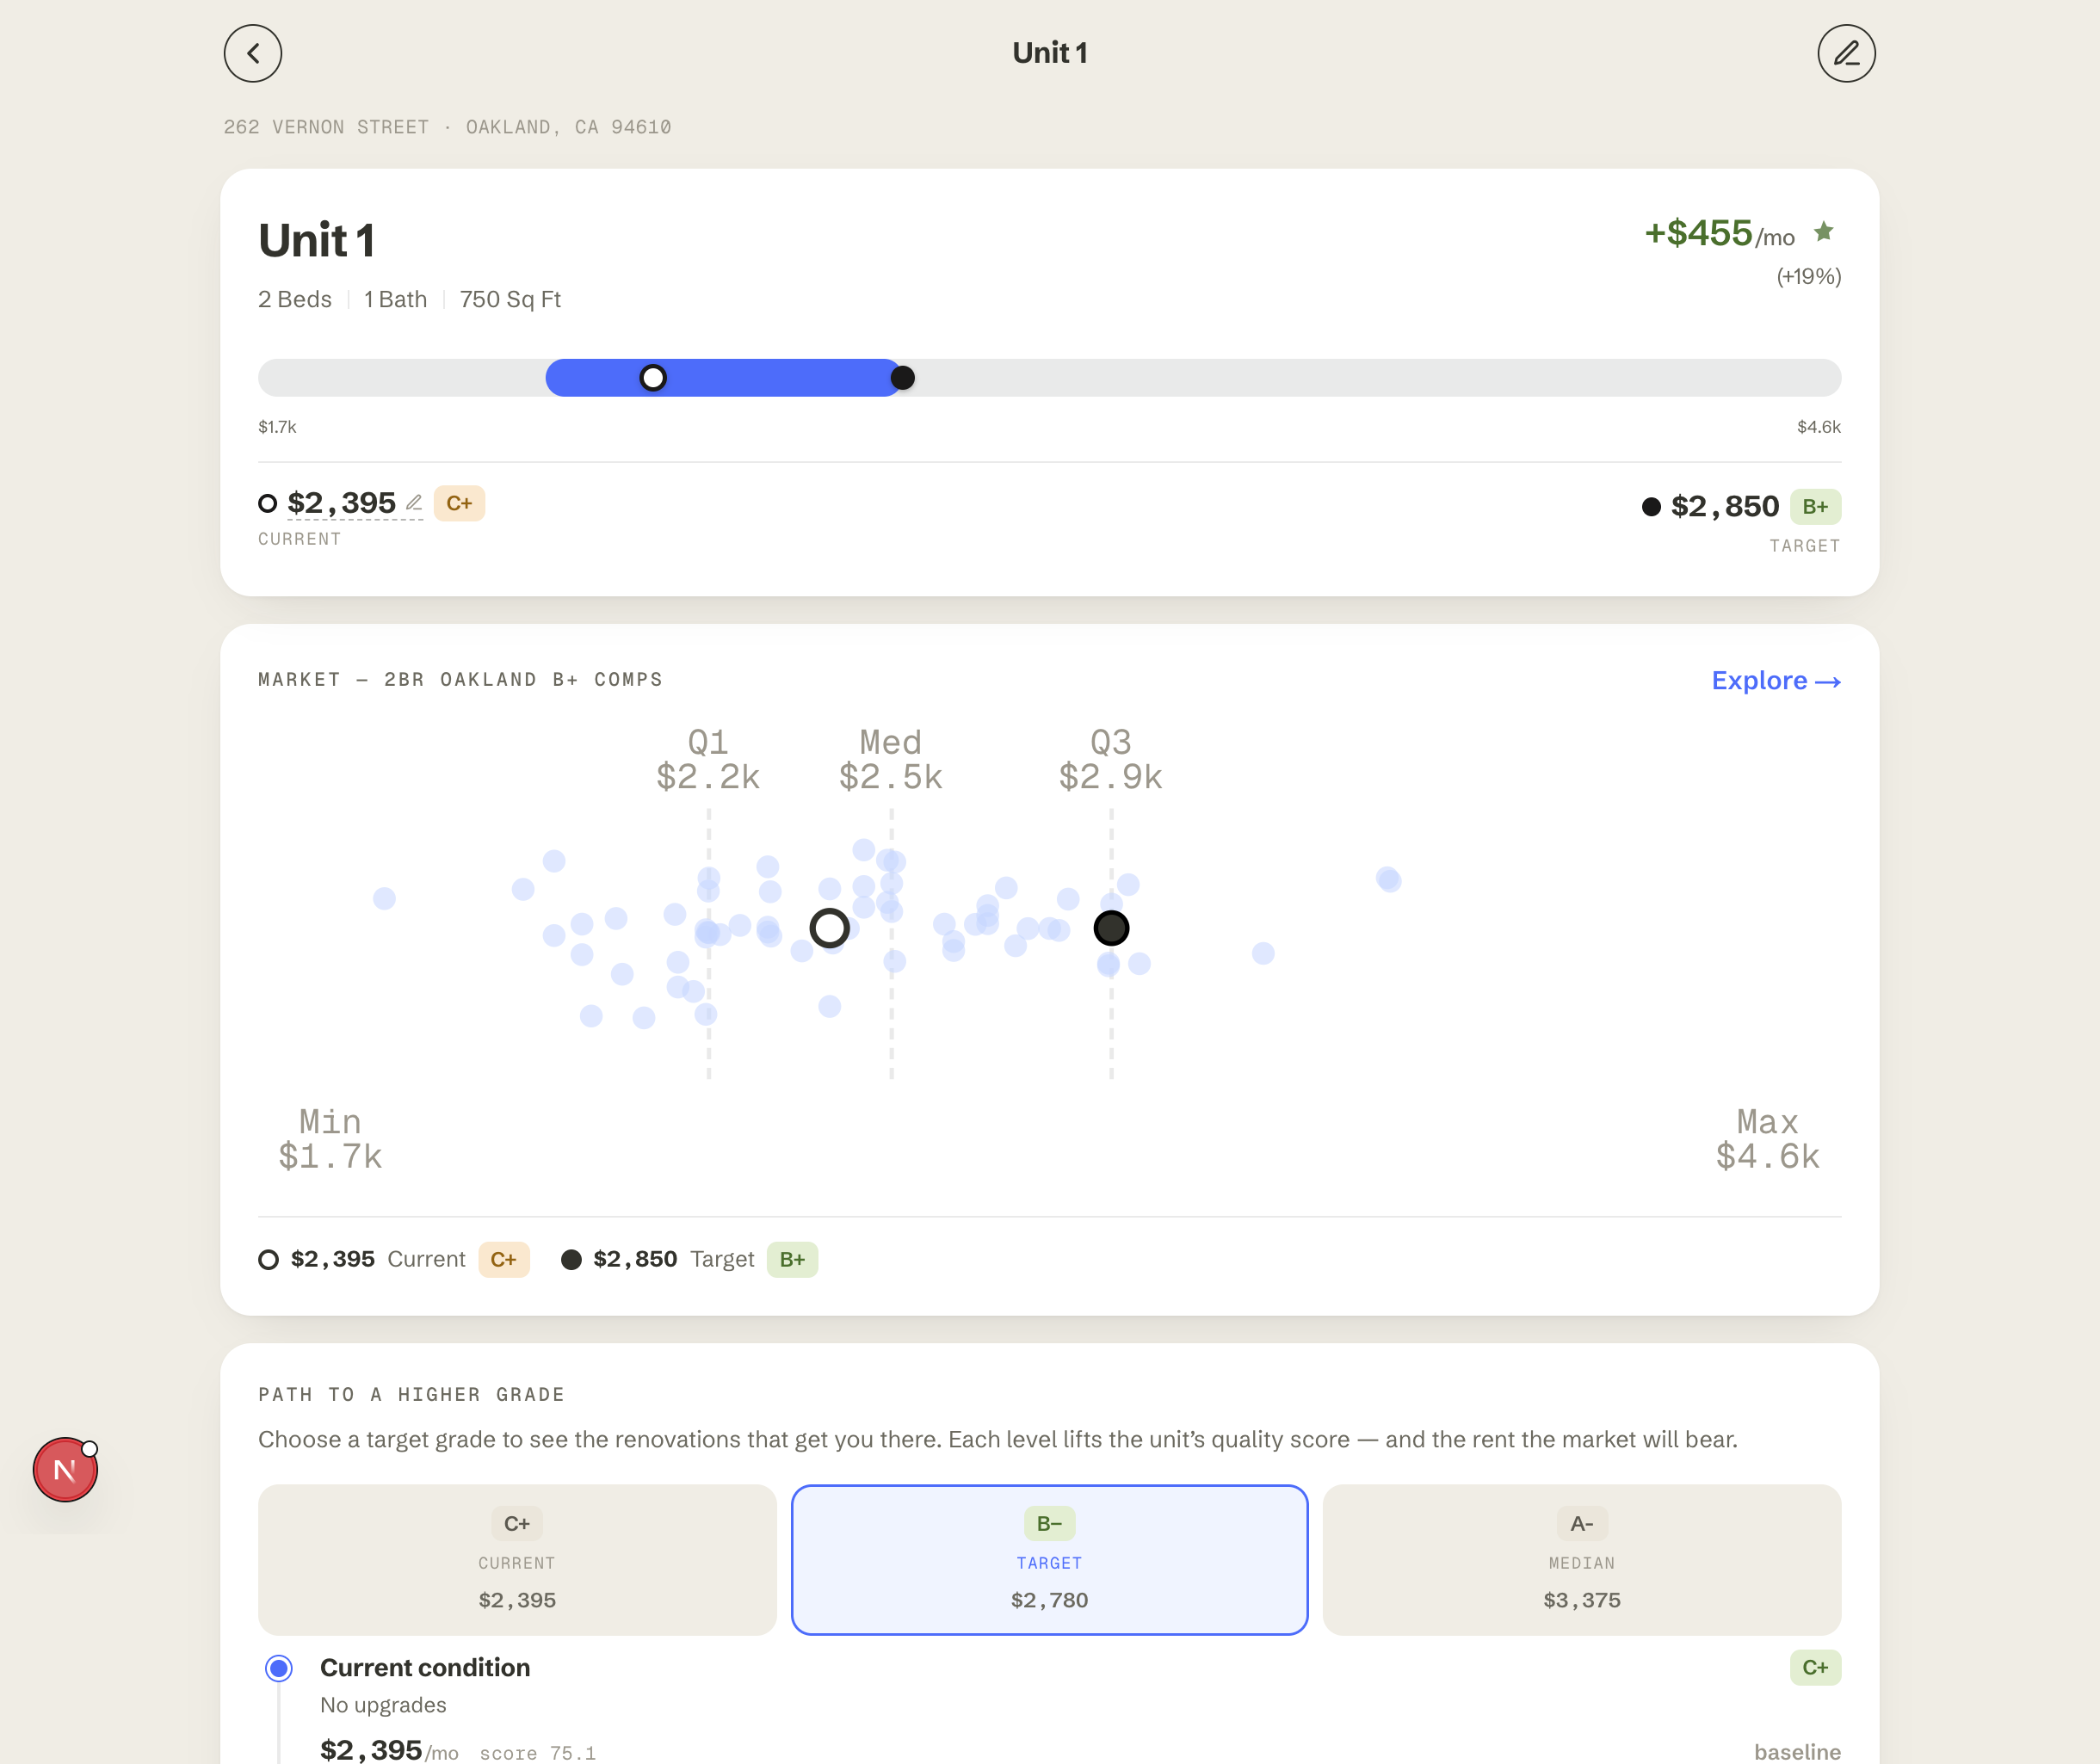
Each unit is benchmarked against nearby comparables, with the characteristics behind the gap and a path to a higher grade.
What I learned
Investors don’t want more data; they want to know what to do next. In testing, clear recommendations tied to rent and cash flow mattered more than analytical depth.
More from the project